· Study management &
data collection
· Graduate Certificate
in Gerontology
· Geographic Information Systems (GIS)
· Pittsburgh Regional Economic Model (REMI)

|
Pittsburgh Perspectives |
Archive List | Link to PEQ |
Thursday, March 02, 2023 09:30 PM (58)
2022 Population Estimates for the Pittsburgh Region
This week the Census Bureau released the latest population estimates for counties across the nation. These new estimates reflect the population as of July 1, 2022, and are based on previous results from the 2020 Decennial Census and estimates of the components of population change over the following years. These county-level population estimates have been aggregated here to compile estimates of the population for the 40 largest metropolitan statistical areas (MSAs) in the United States.
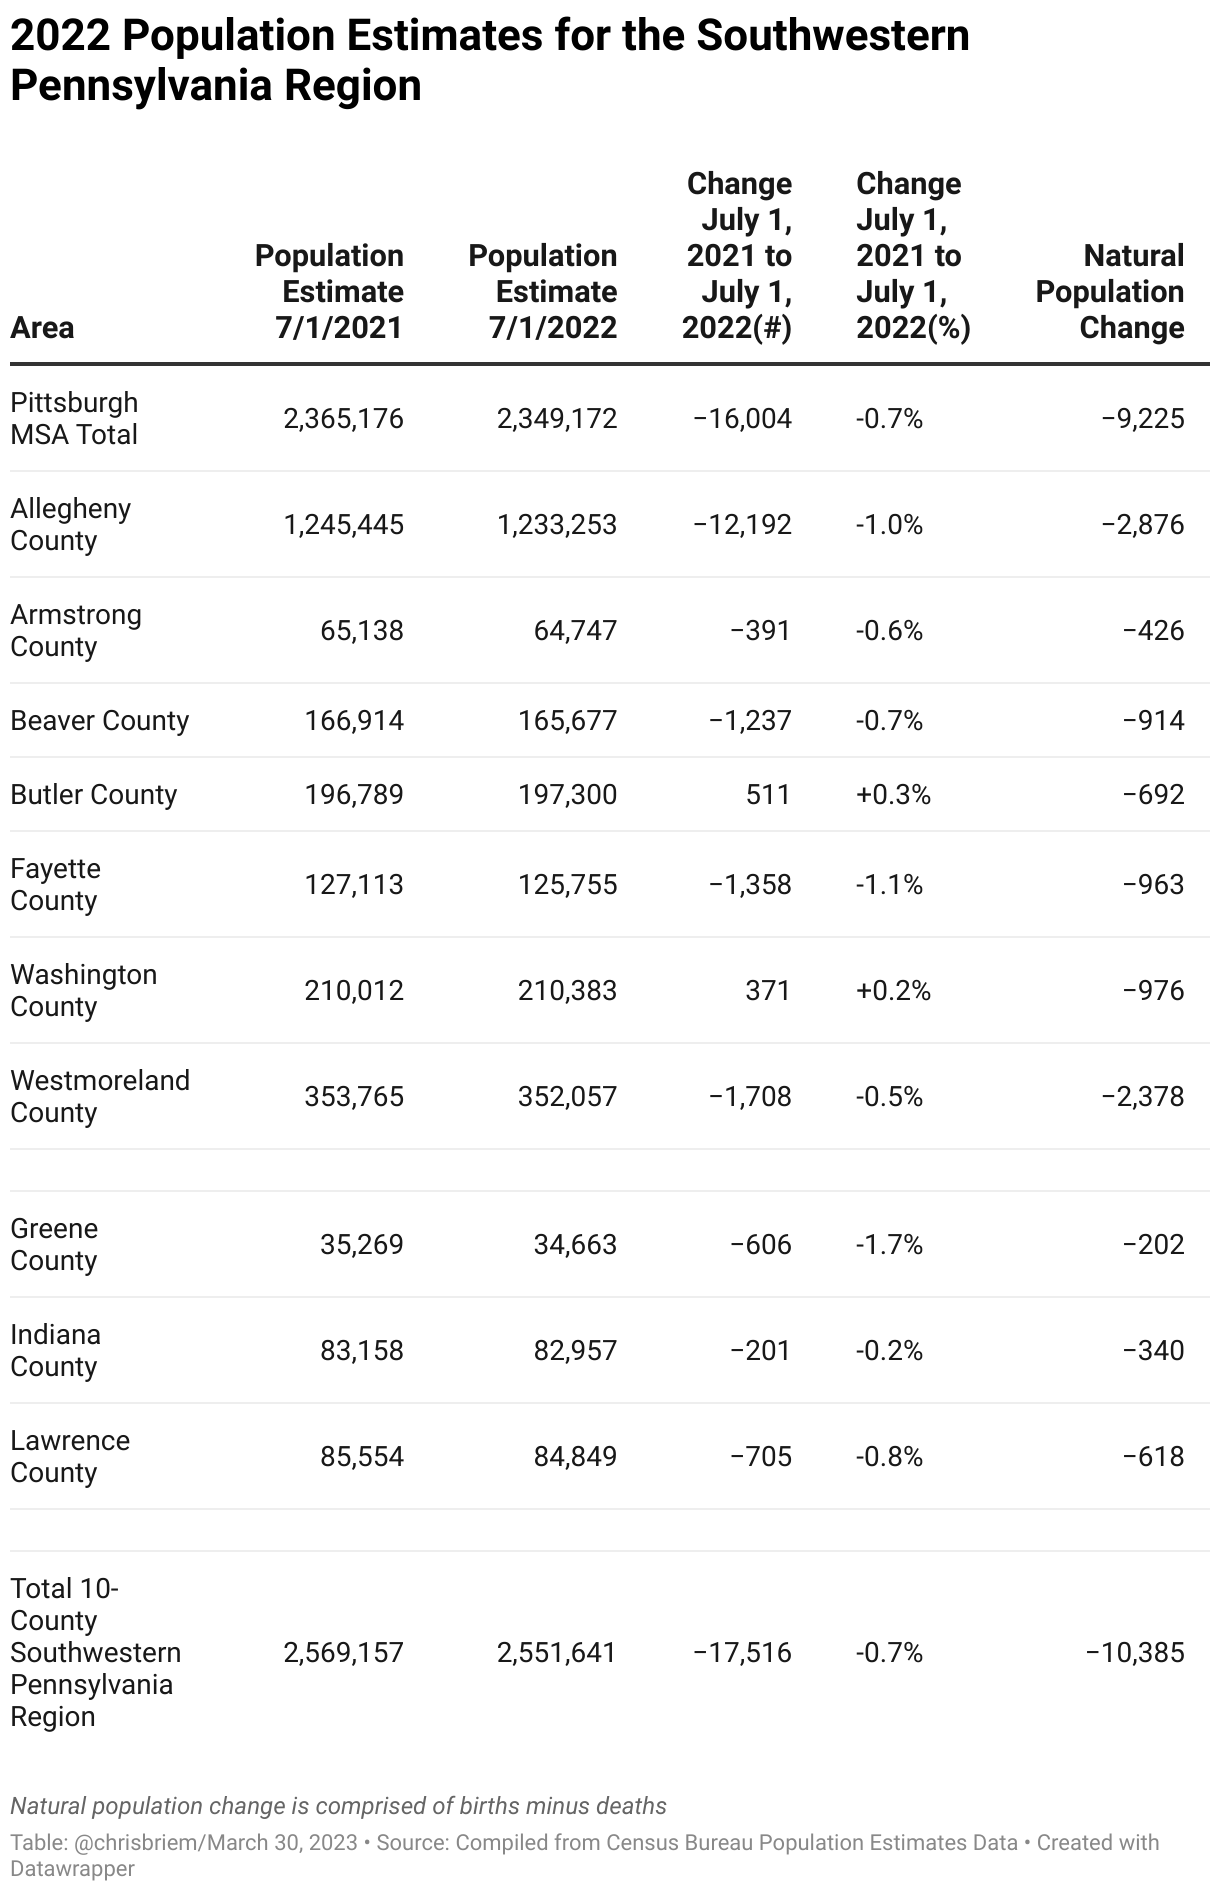
The 2022 population of the seven-county Pittsburgh MSA is estimated to have declined between July 1, 2021, and July 1, 2022, by 16,004 (or -0.7%) to 2,349,172. These estimates show that the Pittsburgh MSA dropped one place to be the 28th largest MSA in the United States.
Within the seven-county Pittsburgh MSA, Allegheny County experienced the largest population decline - contracting by 12,192 - while Fayette County experienced the largest percentage decline (-1.1%) over the year. Butler County (+0.3%) and Washington County (+0.3%) were the only counties in southwestern Pennsylvania to have experienced moderate population gains. The table below summarizes the latest population estimates and major components of demographic change for the 10 counties of southwestern Pennsylvania.
Population change results from a combination of natural population change - the difference between the number of births and the number of deaths - and migration flows. The Census Bureau estimates two type of migration: domestic migration which is the movement of people within the United States and international migration which is the the number of new residents who lived outside of the United States in the previous year.

As an older region, the Pittsburgh region has been experiencing natural population decline (deaths exceeding births) since the mid-1990s. Of the 40largest MSAs in the United States, the Pittsburgh MSA is one of six regions currently experiencing natural population decline. The figure below shows the level of natural population change as a percentage of each region's population for the 40largest MSAs in the United States.
While Pittsburgh gains population due to international immigration, the region stands out in the relatively low rate of international immigration compared to other metropolitan areas. The figure below shows the estimated level of net international migration as a percentage of the population for the forty largest MSAs in the United States.
The remaining major component of demographic change is domestic migration which is the result of the movement of population within the United States. The figure below summarizes the level of net domestic migration as a percentage of population for the 40 largest MSAs in the United States.
_____________________________________________________________________________________________________________________________
For more information contact Christopher Briem (cbriem@pitt.edu)
Supplemental information and figures
Additional information on the Census Bureau's Population Estimates Program: https://www.census.gov/programs-surveys/popest.html
Figure. Population of the forty largest metropolitan statistical areas in the United States in 2022
- 2024-04-05: Regional Labor Force Shifts Since the Onset of COVID-19
- 2024-03-28: 2023 Census Population Estimates for the Pittsburgh Region
- 2023-10-30: Profile of College Students in the Pittsburgh Region
- 2023-07-31: New Definition of the Pittsburgh Metropolitan Statistical Area
- 2023-07-20: What does University of Wisconsin migration research say about recent migration flows impacting Pittsburgh?
- 2023-06-26: Census Population Characteristics - 2022
- 2023-03-02: 2022 Population Estimates for the Pittsburgh Region
- 2023-02-20: IRS Migration Data for Pittsburgh
- 2022-03-25: 2021 Population Estimates for the Pittsburgh Region
- 2022-01-07: Pittsburgh real estate values rising their fastest since the 1970s
- 2021-11-16: Per capita personal income growth in the Pittsburgh region reaches new peak
- 2021-08-24: Preliminary 2020 Population Data for City of Pittsburgh Neighborhoods
- 2021-08-12: First Look at the 2020 Decennial Census: Pittsburgh Region
- 2021-05-05: Final Census Estimates for the Pittsburgh Region Prior to the Decennial Census
- 2021-04-19: EEO Employment Data Update for Pittsburgh
- 2021-02-26: Worker Characteristics of Regional Employment Losses in 2020
- 2020-12-09: Regional GDP Growth
- 2020-12-07: State Employment Projections for the Pittsburgh Region 2018-2028
- 2020-12-03: Pandemic Impacts on Pittsburgh's Restaurant Industry
- 2020-11-23: More on the uneven pandemic impacts in the workforce
- 2020-08-24: EEO Report and Black Workers in the Pittsburgh Region
- 2020-07-01: Changing Age Demographics in the Pittsburgh Region
- 2020-06-23: Foreign-Born Workers in Pittsburgh's Labor Force
- 2020-06-08: Tracking regional unemployment claims
- 2020-05-22: April nonfarm jobs data: Pittsburgh region employment declined by 185,600 over previous month
- 2020-05-18: Strong Regional Gains in Real Personal Income
- 2020-03-30: Statewide Impacts of Business Shutdowns
- 2020-03-26: 2019 Population Estimates for the Pittsburgh region
- 2020-03-20: Estimated Employment Impacts of COVID19 Business Slowdown - March 2020
- 2020-01-16: City of Pittsburgh Neighborhood Profiles
- 2020-01-07: How will the 2020 Census impact redistricting within Pennsylvania?
- 2019-12-12: Ethane cracker construction generates GDP growth for Beaver County
- 2019-11-14: Solid growth for personal income in the Pittsburgh region
- 2019-11-07: Veterans Population Update
- 2019-09-13: The Supplemental Poverty Measure
- 2019-08-31: Unionization in the Pittsburgh Labor Market
- 2019-06-24: College-Educated Women in the Workforce
- 2019-05-07: Pittsburgh's Opportunity Occupations
- 2019-04-18: 2018 Population Estimates
- 2019-04-08: Homeownership in Pittsburgh
- 2019-03-25: Understanding Regional Occupation Shifts 2010-2017
- 2019-02-11: Pittsburgh's highly educated immigrants
- 2019-01-28: Ongoing demographic change in the City of Pittsburgh
- 2019-01-10: Pittsburgh's North Side and what might have been
- 2019-01-04: How low has Pittsburgh's unemployment rate ever gone?
- 2018-12-18: Expanding Research Employment in the Pittsburgh Region
- 2018-12-13: County-Level Gross Domestic Product (GDP) Estimates Now Available
- 2018-11-26: Pittsburgh's unemployment rate compared to the nation
- 2018-11-20: Pittsburgh Redevelopment Circa 1958
- 2018-11-15: Millennials and change in City of Pittsburgh neighborhoods PrevNov15
- 2018-11-09: Veterans in Pittsburgh
3343 Forbes Ave
Pittsburgh, PA 15260
ucsur@pitt.edu · 412-624-5442