· Study management &
data collection
· Graduate Certificate
in Gerontology
· Geographic Information Systems (GIS)
· Pittsburgh Regional Economic Model (REMI)
Back to Center Reports
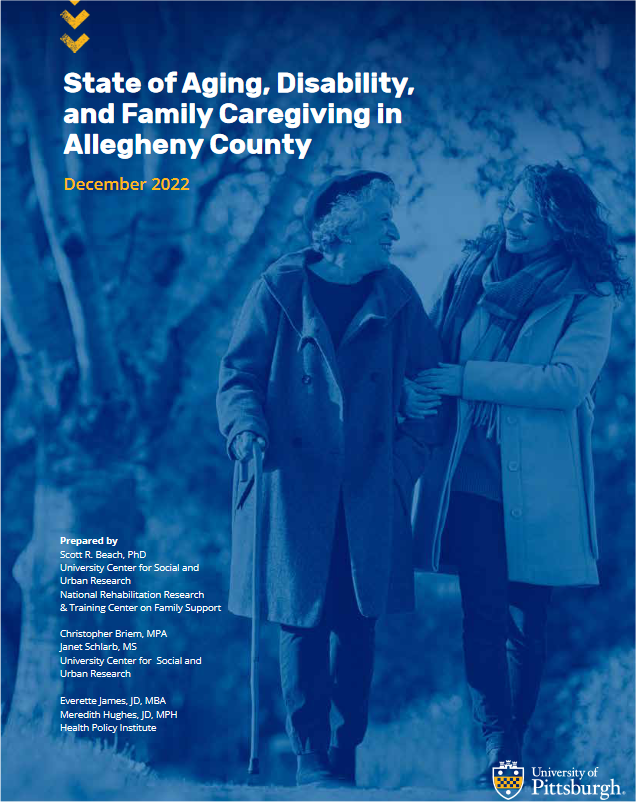
State of Aging, Disability, & Family Caregiving
in Allegheny County - December 2022

Understanding the characteristics of Allegheny County’s aging and disabled residents is critical to planning for a healthy and prosperous future for our region. While the broad demographics of our population being older with more prevalent disability than other U.S. counties is well-known, current detail on the perspectives of these individuals, their unmet needs, and racial and gender disparities is lacking. Information on vulnerable sub-groups and key issues like housing, workforce participation, transportation, retirement savings, and access to healthcare and social supports is essential to informed program planning, policymaking, and resource allocation.
This report details findings from the 2022 State of Aging, Disability, and Family Caregiving in Allegheny County project, funded by the Henry L. Hillman Foundation. The study was conducted by the University Center for Social & Urban Research (UCSUR), National Rehabilitation Research & Training Center on Family Support (NCFS), and the Health Policy Institute (HPI) at the University of Pittsburgh in partnership with various local organizations.
State of Aging, Disability, & Family Caregiving in Allegheny County
December 14, 2022
Webinar Video Recording
from Wednesday, December 14th, 2022
Speakers
• Everett James, JD, MBA - HPI - Introduction
• Scott R. Beach, PhD - UCSUR - Overview, Methods, & Key Findings
• Chris Briem, MPA - UCSUR - Demographic Trends & Population Forecasts
• Meredith Hughes, JD, MPH - HPI - Policy Implications
• Shannah Tharp Gilliam, PhD - Area Agency on Aging - Commentary & Aging Services Perspective
Age-Friendly Community Index - Supplemental Report
Age-Friendly Community Index - Interactive Map
2022 vs 2014 Change Over Time Summary
Presents data for all survey questions that were repeated in 2014 and 2022, including estimates for the total sample age 55 and older, and separate estimates for the Black and non-Black sub-populations.
View our 2014 Allegheny County State of Aging Survey
Age Breakout Summary
Presents data for key survey indicators for detailed age-subgroups, including all adults age 55 and older; all adults age 65 and older; and the following sub-groups: 55 – 54; 65 – 74; 75 and older.
•••••••••••••••••••••••••••••••••••••••••••••••••••••••••••••••••••••••••••••••••••••••
Demographic Group Profiles
Presents full profiles for the following socio-demographic groups: females, age 55 – 64, Blacks, Lower education, lower income, and lives alone. Profiles consist of all key survey indicators for which the profile group scores at higher risk.
Key for Items Below
Survey Toplines: Contain weighted frequencies on all original survey variables.
Infographics: Contain descriptive infographics on survey findings.
Detailed Graphs: Contain graphics showing breakdowns of all key survey indicators by socio-demographic variables; and disability, caregiving, and living alone status. Also, graphics showing sub-groups scoring highest / lowest (i.e., at greatest risk) on all key survey indicators.
Supplement
Supplement
Supplement
Supplement
Supplement
Supplement
Supplement
Supplement
Supplement
Supplement
Supplement
Supplement
Supplement
Supplement
Supplement
Prepared By
• Scott Beach, PhD (UCSUR)
• Christopher Briem, MPA (UCSUR)
• Janet Schlarb, MS (UCSUR)
• Everette James, JD, MBA (HPI)
• Meredith Hughes, JD, MBA (HPI)
Funded By
Collaborating Partners
- Allegheny County Department of Human Services
- Area Agency on Aging (AAA)
- Allegheny County Health Department
- United Way of Southwestern Pennsylvania
- UPMC Senior Services
- FISA Foundation
- City Task Force on Disabilities
- The Arc of Greater Pittsburgh / Achieva
- Age-Friendly Greater Pittsburgh
- Jewish Healthcare Foundation
3343 Forbes Ave
Pittsburgh, PA 15260
ucsur@pitt.edu · 412-624-5442


